The State of Safety in America 2025

Every year, we talk to at least 5,000 people to gauge their sense of safety living in the U.S. to find out which states worry the most about safety, which ones worry least, and where people have experienced the most run-ins with different types of crime. 

This report provides an overview of our findings and presents a snapshot of how Americans perceive their safety and what they're doing about it.

Executive summary: Americans' evolving safety concerns in 2025

Americans' perception of personal and public safety has remained relatively stable over the past year, but what we're worried about—and who's most worried—is shifting.

While three in five say crime has increased compared to last year, that number is actually at its lowest point in years. More stats than ever are saying crime may actually be going down.

Still, safety is far from a non-issue. Only about half of Americans say they feel safe in their state, and the focus of concern has changed. In 2024, theft and burglary were the most concerning crimes, with gun violence and cybercrime close behind. That's a notable shift from just a couple of years ago, when general crime rates and COVID-19 were front and center.

Cybercrime, in particular, now stands out as the single biggest safety concern for Americans. But that doesn't mean traditional crime is off the radar. More people say they're worried about violent crime, gun violence, and property crimes happening to them personally than in recent years, especially when looking back at their concerns from 2023.

All of this adds up to a safety mindset that's evolving quickly, even if the broader level of anxiety has stayed mostly the same.


Which states are the most worried about crime and safety?

Every year, we ask Americans how much they worry about crime and safety, in general. The country has hovered around the 50% mark for years, with nearly half of Americans regularly worrying about safety. This year, 47% of survey respondents expressed a high level of concern about their safety. The most concerned state, California, saw 67% expressing concern, while the least concerned state, Vermont, saw 29% expressing concern. 

The states that reported the most and least concern about crime and safety. Image: SafeWise, State of Safety report, B1. Using a scale from 1 to 7, where ‘1’ is not at all concerned and ‘7’ is very concerned, overall, how concerned were you about your safety and/or security in 2024? Among each state, 100n.

The most worried states: 

1. California, 64%
2. Alabama, 60%
3. (tie) New Mexico, 58%
3. (tie) Tennessee, 58%
5. Pennsylvania, 57%
6. Louisiana, 56%
7. (tie) Maryland, 55%
7. (tie) Mississippi, 55%
7. (tie) New Jersey, 55%
10. Delaware, 52%

The least worried states:

1. Vermont, 29%
2. Wyoming, 30%
3. North Dakota, 33%
5. (tie) Iowa, 36%
5. (tie) South Dakota, 36%
9. (tie) Alaska, 39%
9. (tie) Idaho, 39%
9. (tie) Minnesota, 39%
9. (tie) Oklahoma, 39%

Notepad
U.S. average

47% of respondents are concerned about crime and safety.

Curious about crime and safety in your area?
We've got the goods. Sign up for our weekly newsletter emails to get the latest safety news and tips to make your life safer.

By signing up, you agree to our Terms and Conditions and Privacy Policy.

States where people feel the most and least safe

On top of asking people how much they worry about safety every day, we wanted to find out if people feel safe in their state. Nationwide, 48% of Americans feel safe in the state they call home, one percentage point higher than the percentage that regularly worry about crime and safety.

Nebraska is the state where the highest number of residents (71%) report feeling safe. Unsurprisingly, Nebraskans ranked in the middle (25th place) for the percentage of people who increased their safety and security measures in 2024.

New Mexico has the lowest percentage of residents (28%) who report feeling safe. Despite New Mexicans reporting lower feelings of safety, the state ranked 15th for the percentage of people who have increased their safety and security measures. 

The states that reported feeling the most and least safe in their state. Image: SafeWise, State of Safety report, B4. Using a scale from 1 to 7, where ‘1’ is not at all safe and ‘7’ is very safe, overall, how safe do you think your state is so far in 2024? among all.

The states that feel the most safe:

1. Nebraska, 71%
2. Idaho, 70%
3. (tie) North Dakota, 68%
3. (tie) South Dakota, 68%
3. (tie) Wyoming, 68%
6. Iowa, 66%
7. (tie) Maine, 62%
7.( tie) Utah, 62%
9. Massachusetts, 61%
10. Vermont, 60%

The states that feel the least safe:

1. New Mexico, 28%
2. Oklahoma, 29%
3. Oregon, 34%
4. Missouri, 35%
7. (tie) Georgia, 36%
7. ( tie) Illinois, 36%
7. (tie) Louisiana, 36%
8. Alabama, 38%
10. (tie) Kentucky, 39%
10. (tie) Nevada, 39%


Notepad
U.S. average

48% of people feel safe in their state.

Crime and safety trends

Roughly half of Americans report being concerned about safety, consistent with the findings from our 2022 survey. While perceived crime rates are directionally lower than in 2022, safety fears are now more focused on theft, burglary, and gun violence — displacing pandemic-era health anxieties.

One of the most surprising findings is that more Americans believe crime has decreased in the past year compared to 2022. However, the overwhelming majority still believe that crime overall increased in 2024.

A bar graph showing which safety and security concerns Americans told us they worry about the most, in their own words. Image: SafeWise State of Safety report, B2. What was your biggest safety or security concern in the past year? Among all, 5000n.

In open-ended questions, people mentioned concerns about safety at home, walking/running in their neighborhoods, and on the roads (road rage). We also saw more mentions of social issues like immigration and unhoused populations.

This graph shows how concerned Americans have been about different crimes over time, from 2020 to 2024. Image: SafeWise State of Safety report, C1. Using a scale from 1 to 7, where ‘1’ is not at all concerned and ‘7’ is very concerned, how concerned are you about the following happening to you in 2024? Among all in 2024, 5000n; 2022, 5000n; 2021, 5000n; 2020, 5026n.

Top concerns

For the first time, cybercrimes topped the list of crime concerns, especially for older adults, who reported increased concern and increased experiences with cybercrime last year. Violent crimes and gun violence are the second-highest concerns, with younger adults (below 55) and women reporting the most concern.

Although not at the top of the list, concern about property crime is rising, especially among women and parents, even as actual experience levels remain consistent with those of previous years. Package theft continues to top the list of most-reported crimes (especially in Washington), even if it's a lower concern overall.


“I was worried most about my car being broken into or items such as packages being stolen.”

—18-24, Male, Northeast
“I am concerned about being safe at night in my own house.”

—25-34, Female, Midwest
“Gun violence. With school shootings to gang violence, you can’t escape it.”

—18-24, Female, Midwest

Top issues

When it comes to social and political issues, the economy is the biggest concern, with four in five Americans expressing worry about it. Gun control and immigration are the next most-concerning issues, with over half of all respondents expressing concern.

Concerns about extreme weather have sharply increased, but self-reported evacuation rates have remained steady.

The social and political issues that Americans are most concerned about. Image: SafeWise State of Safety report, B10. Using a scale from 1 to 7, where ‘1’ is not at all concerned and ‘7’ is very concerned, how concerned are you about the following issues? Among all, 5000n.

Cybersecurity and tech

More than half of Americans reported being more concerned about cybercrime in 2024 than they had been the previous year. Older adults are more concerned and more likely to use a protective method. Among all respondents, one in three reported experiencing some form of cybercrime in 2024.

Cyber protection is now mainstream, with nearly three-quarters of respondents relying on at least one method of protection. Two-factor authentication and antivirus software are the most widely used. One in seven reported adding new cyber protection methods last year.

For more information on cybercrime affecting children, check out our Kids Internet Safety Guide.

Anti-virus software is the most widely used cybersecurity tool. Image: SafeWise State of Safety report, D10. Do you currently use any of the following to provide cybersecurity? Among those who currently use a method of cybersecurity, 3669n.

Most people avoid clicking on suspicious texts and links to protect against cybercrime. Image: SafeWise State of Safety report, D9. Which of the following best describes how you use cybersecurity measures? Among those who currently use a method of cybersecurity, 3669n.

Extreme weather and natural disasters

With recent events like the Los Angeles area fires and ongoing extreme weather alerts across the country, it's no surprise that Americans are more worried about natural disasters than ever before. More than half of all survey respondents told us they're concerned about extreme weather and natural disasters, the highest we've seen.

Fortunately, higher levels of concern don't match higher evacuation rates. In 2024, only 10% told us they'd been under an evacuation order, which is in line with the findings from our 2022 survey.

This disconnect between rising concern and steady evacuation rates may reflect heightened awareness, more frequent weather warnings, or increased media attention. Whatever the reason, Americans are paying closer attention to the weather — and many are feeling less safe because of it.

Extreme heat and cold are the most worrisome natural disasters for Americans. Image: SafeWise State of Safety report, F1. Using a scale from 1 to 7, where ‘1’ is not at all concerned and ‘7’ is very concerned, overall, how concerned were you about the following natural disasters this year?

2021 saw more Americans under evacuation orders than 2022 or 2024. Image: SafeWise State of Safety report, F2. Did you (or the area where you live) experience evacuation due to natural disasters (e.g., hurricane, fires/smoke, flooding, etc.) this year? Among all in 2024, 5000n. 2022, 5000n. 2021, 5000n.


How do Americans protect themselves?

As concerns around theft, gun violence, and cybercrime grow, more Americans are taking action to protect themselves — both at home and on the go. The driving force behind this shift? A desire to prevent future incidents. In fact, preventing a security or safety breach is now the number one reason people are investing in protection, and mentions of that motivation have grown significantly since 2022.

This shift isn’t just about fear — it’s about lived experience. People who’ve already encountered crime, or feel generally unsafe, are much more likely to have added new protection methods this year. That includes everything from upgrading home security systems to carrying personal protection tools.

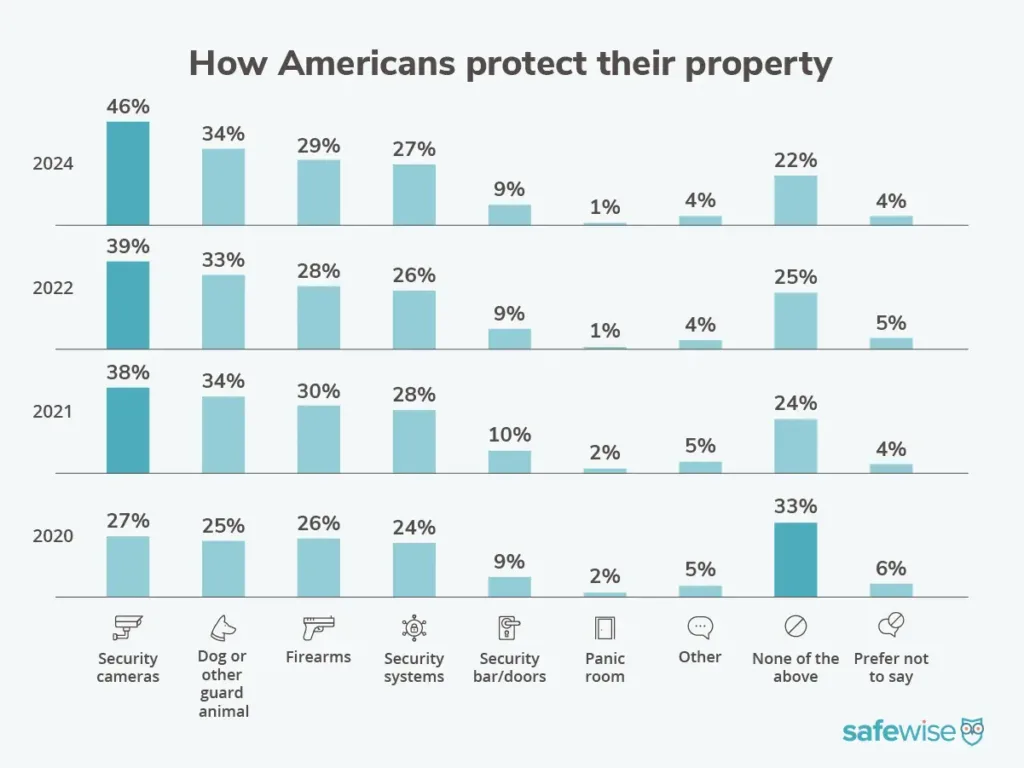
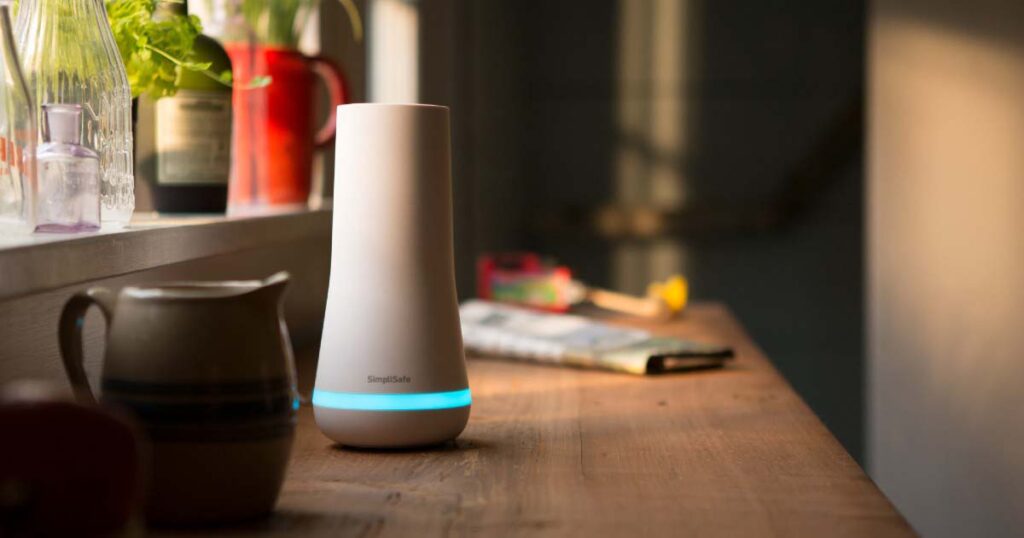
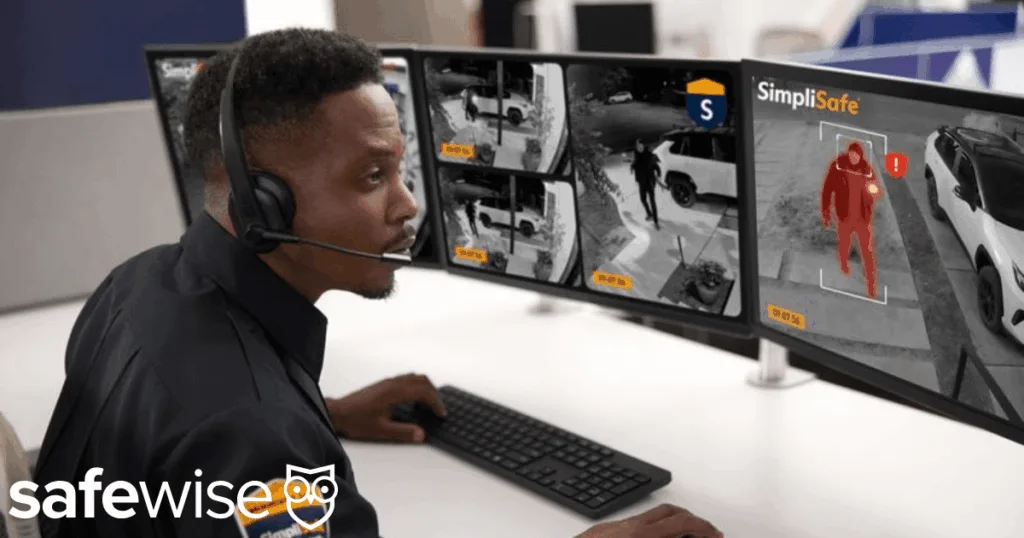
On the property side, the use of security cameras has jumped meaningfully compared to previous years, and more people are turning to insurance, alarm systems, and other home safety tools to feel more secure. Auto and homeowner’s insurance, along with fire alarms and monitored systems, remain go-to choices for many.

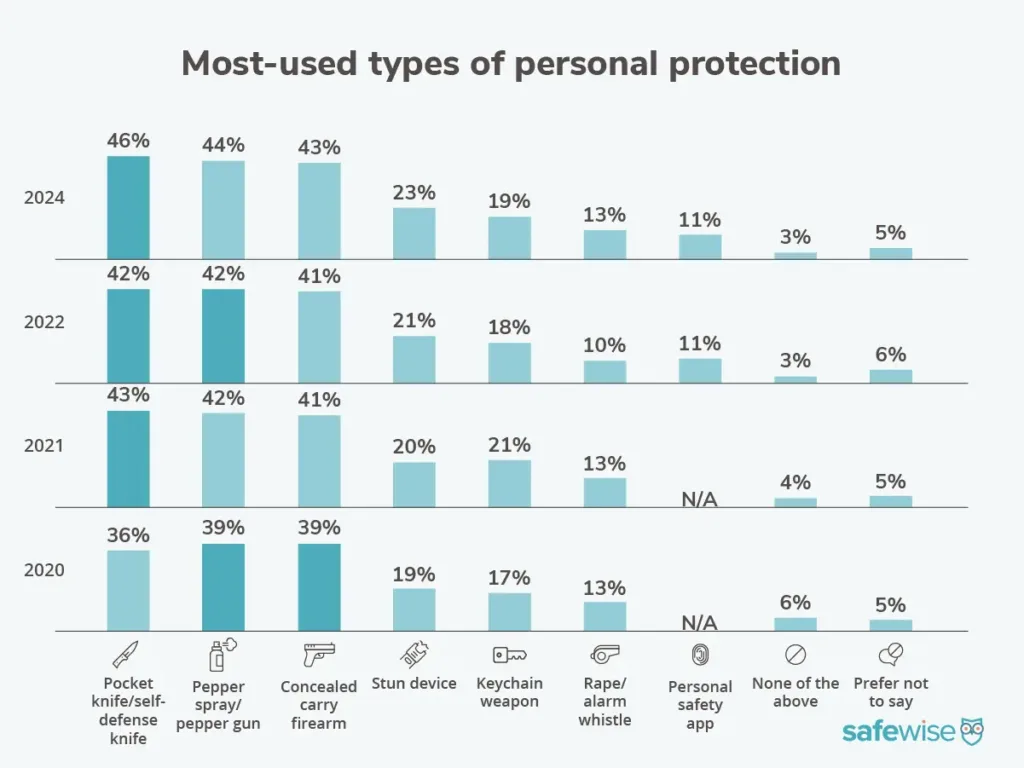
When it comes to personal safety, Americans are reaching for what feels accessible and effective. Pocketknives, pepper spray, and firearms continue to be the most commonly used tools, though preferences vary by gender and household. Men lean more heavily toward knives and firearms, while women more often carry pepper spray. Households with children are turning to a wider range of options, from stun guns to safety apps to protective keychains.

All of these points indicate a clear trend: Americans aren’t just more aware of safety issues — they’re increasingly willing to take matters into their own hands.

Comparison of the methods Americans use to protect their property over time, from 2020 to 2024. Image: SafeWise State of Safety report, D2. Do you currently use any of the following to protect your property? Among all in 2024, 5000n. 2022, 5000n. 2021, 5000n. 2020, 5026n.

Property protection trends

More Americans are investing in home and personal security, with two in five increasing their security or safety measures year-over-year. Still, many Americans (22%) don't have formal protection in place. Fire alarms, life insurance, and homeowners' insurance remain top go-to methods.

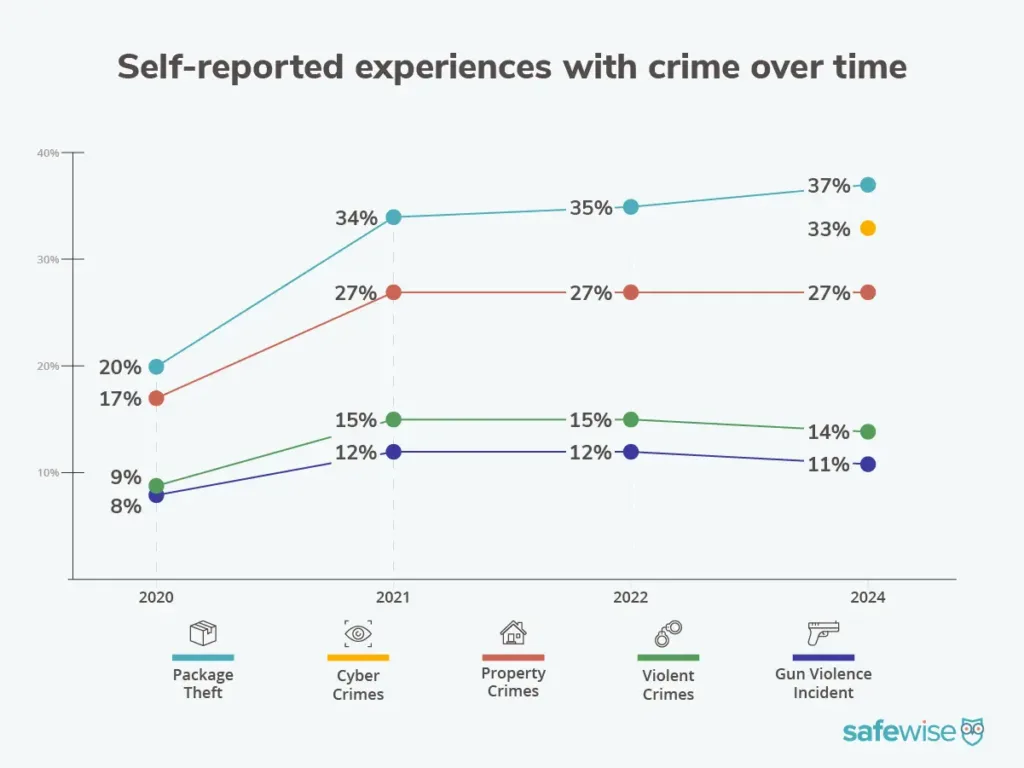
Security cameras saw a notable increase in use this year, jumping 18% from 2022. Other property protection methods, like home security systems, guard animals, firearms, and security bars held stable in use compared to 2022. Preventing a future security or safety breach is the number one reason people increased their security methods. Neighborhood crime, family and friend recommendations, and experiencing a safety or security breach are the next most common reasons for adding extra security.

Comparison of the methods Americans use to protect their property over time, from 2020 to 2024. Image: SafeWise, 2022 State of Safety report, D5. Do you use any of the following for personal protection? Among those who carry or use a method of personal protection/safety in 2024, 1758n. 2022, 1817n. 2021, 1974n. 2020, 1604n.

Personal protection trends

For personal protection, safety tools like pepper spray, knives, and firearms are used most often, with gender and household makeup influencing preferences. Men are more likely to own personal protection devices like firearms and knives, while women favor pepper spray. Households with children are most likely to use personal safety apps, stun guns, and defensive keychain weapons.

Online shopping for safety tools is on the rise, compared to 2022, with significantly less shopping at physical stores and with local professionals.

Why people increased security and safety measures

“To protect my family in case of a break in as well as protection from wild animals. We got the security system to prevent break ins and thefts of packages, tools, or other outdoor items.”

—18-24, Female, Northeast
“The increasing crime in the urban area has concern. I need to protect family makes me cautious about all that is going on around the city and the neighborhood.”

—65+, Male, Midwest

Crime in real life: What Americans are actually experiencing

While public concern around safety remains high, the types of crime Americans are actually experiencing paint a more focused picture. Overall, rates of self-reported crime in 2024 look similar to 2022, but some key trends stand out — especially when it comes to theft and digital threats.

Package theft continues to be the most commonly reported crime, and it's still on the rise. Incidents hit an all-time high this year, with more Americans than ever saying they've had a package stolen since tracking began in 2020. Property crime and cybercrime follow closely behind, with each reported by roughly one in three Americans.

In contrast, violent crimes and gun violence are far less frequently experienced but remain some of the most feared. That gap between concern and actual experience likely reflects the severity and unpredictability of those incidents, even if they're statistically less common.

The percentage of survey respondents who reported a personal experience with crime. Image: SafeWise, 2022 State of Safety report, C2. Have you, or anyone you know, experienced the following in 2024 so far? Among all in 2024, 5000n. 2022, 5000n.

Certain groups are consistently less likely to report experiencing crime. Adults 55 and older — who also tend to feel safer overall — are the least likely to say they've encountered any kind of crime. Households without children also report lower personal experiences with crime across the board.

States with the highest self-reported crime

The states with the highest number of people reporting personal experiences with different types of crime in 2022 and 2024. Utah is the only state that appears in both years: it reported the highest package theft in 2022 and the highest cybercrimes in 2024. Image: SafeWise, 2022 State of Safety report, C2. Have you, or anyone you know, experienced the following in 2024 so far? Among all in 2024, 5000n. 2022, 5000n.

These are the states with the highest and lowest reported experiences with crime:

Property crimes:

  • New Mexico, 46%
  • Massachusetts, 16%
  • U.S. average, 27%

Violent crimes:

  • Kentucky, 28%
  • South Dakota, 6%
  • U.S. average, 14%

Package theft:

  • Washington, 48%
  • Vermont, 29%
  • U.S. average, 37%

Gun violence incident:

  • Georgia, 20%
  • Rhode Island, 5%
  • U.S. average, 11%

Cybercrimes:

  • Utah, 48%
  • South Carolina, 23%
  • U.S. average, 33%

All told, while the fear of crime remains a powerful motivator, what Americans experience varies widely depending on where they live, their age, and whether they're raising children.

Comparison of the self-reported crime experiences from 2020 to 2024. Image: SafeWise, 2022 State of Safety report, C2. Have you, or anyone you know, experienced the following in 2024 so far? Among all in 2024, 5000n; 2022, 5000n; 2021, 5000n; 2020, 5026n.


How much do people worry about crime in your state?

State Name
Overall level of concern
% feels safe in state
% added security or safety measures
% think crime is increasing
National47% 48%37%61%
Alabama60% 38%43%72%
Alaska39% 40%44%62%
Arizona48% 41%35%62%
Arkansas40% 49%35%59%
California64% 41%45%63%
Colorado49% 46%35%62%
Connecticut48% 53%35%50%
Delaware52% 50%42%62%
Florida48% 47%43%54%
Georgia54% 36%39%58%
Hawaii54% 40%32%71%
Idaho39% 70%38%65%
Illinois48% 36%34%58%
Indiana43% 51%35%62%
Iowa36% 66%32%45%
Kansas46% 42%37%66%
Kentucky50% 39%40%65%
Louisiana56% 36%38%70%
Maine41% 62%39%60%
Maryland55% 40%27%54%
Massachusetts50% 61%41%53%
Michigan51% 52%34%58%
Minnesota39% 44%35%64%
Mississippi55% 54%39%72%
Missouri42% 35%37%64%
Montana40% 56%34%67%
Nebraska40% 71%36%58%
Nevada54% 39%32%65%
New Hampshire44% 58%40%58%
New Jersey55% 47%38%60%
New Mexico58% 28%39%68%
New York47% 42%44%59%
North Carolina40% 40%33%72%
North Dakota33% 68%30%62%
Ohio44% 46%41%67%
Oklahoma39% 29%43%66%
Oregon46% 34%35%64%
Pennsylvania57% 55%38%61%
Rhode Island41% 50%26%49%
South Carolina50% 44%33%63%
South Dakota36% 68%33%60%
Tennessee58% 51%38%71%
Texas52% 42%40%66%
Utah46% 62%45%56%
Vermont29% 60%35%54%
Virginia46% 47%32%56%
Washington50% 42%35%58%
West Virginia45% 45%43%62%
Wisconsin42% 54%29%52%
Wyoming30%68%35%58%

What is the State of Safety survey?

The State of Safety is a nationwide survey that dives into America’s top safety concerns. Over the past six years, we’ve surveyed more than 30,000 Americans—at least 600 from every state—to find out their perceptions and attitudes about safety and crime.

We use this data to spot trends in how people perceive safety and danger, as well as respondents’ experiences with different types of crimes. We also compare perceptions of safety and danger with the reality of crime statistics in our Safest Cities reports.

Based on participants’ answers and data trends, we’ve adapted the survey each year to respond to current events and areas of growing concern.

Find out more about the State of Safety study on our methodology page.

2018

  • First State of Safety survey was fielded
  • 6 areas of safety were explored: Violent crime, property crime, digital security, health and wellness, environmental safety, workplace safety

2019

  • Second survey fielded
  • Added questions about mass shootings

2020

  • Narrowed focus to property and violent crime
  • Introduced questions about gun violence beyond just mass shootings

2021

  • Added questions about package theft, police violence, and the COVID-19 pandemic
  • Began prioritizing a representative demographic sample (economic and racial/ethnic diversity)

2022

  • Expanded focus to include natural disasters
  • Added more depth to questions about package theft
  • Included new questions about cybercrime

2023

  • No survey was fielded in 2023; instead, perceptions were captured using reflective questions in our 2024 survey.

2024

  • Added questions about cybersecurity practices and protections people are using
  • Asked about concern levels around current political and social issues, including:
    • The economy
    • Immigration
    • Gun control
    • Gender
    • Religion

How to make a safe home anywhere

We encourage everyone to be proactive about home security. One of the best ways to stop a burglary before it happens is to add a home security system.

Light Bulb
Get a home security system

Find out which companies we recommend for every budget and lifestyle in our roundup of the top alarm systems—and learn the basics with our guide on Everything You Need to Know About Home Security

Find security and safety resources in your area

Rebecca Edwards
Written by
Rebecca is the Managing Editor and lead safety expert at SafeWise.com, where she's been researching, testing, and writing about home and personal security for over 12 years. Her safety smarts come from both real life and professional experience—as a single parent trying out safety and security gadgets to protect her family and a former college director responsible for safety plans and strategies to keep buildings, grounds, and hundreds of students and faculty safe every day. With 30 years of experience as a journalist and blogger, she's become a go-to source for trustworthy, practical advice on everything from the best home security systems and smart gadgets to keeping kids safe online, preventing package theft, and understanding crime trends nationwide. PBS NewsHour, The Today Show, NPR, Vice, TechCrunch, The Washington Post, HGTV, Marketplace, On the House, and more have featured Rebecca's expert insights and recommendations. Whether it's protecting your home, your loved ones, or your peace of mind, Rebecca makes safety simple, doable, and real.

Recent Articles

Bark Watch Review
A kids smartwatch can be a safe way to introduce kids to texting. The Bark...
Best smartwatches for kids 2024
Best Smartwatches for Kids | Tested by Parents and Kids in 2025
We researched and tested to find the best kids smartwatches that are actually worth your...
SimpliSafe Smoke & Carbon Monoxide (CO) Alarm Listener being installed
SimpliSafe Has a New Way to Keep You Safe
SimpliSafe’s new Smoke & CO Alarm Listener connects your existing detectors to its system for...
Tranquil Watch Review
The Tranquil Watch looks like a classic analog watch but connects with a Bluetooth alarm...